
Looker Studio Dashboard
SEO Acquisition & Conversion Analysis
The Challenge
SEO marketers often struggle with quantifying their efforts, especially when correlating traffic generation with tangible business results. Traditional tools might show surface-level metrics but miss the deeper connections between SEO activities and conversions.
The Solution
Enter the Looker SEO Dashboard. Integrated with Google Search Console & GA4 (Google Analytics), it monitors SEO traffic patterns and conversions while contrasting them with historical data and spotlighting top-performing queries. It’s the bridge from SEO actions to clear business outcomes.
The Tools
- Looker
- Google Analytics (GA4)
- Google Search Console
The Dashboard

SEO Acquisition Page
Powered by Google Analytics (GA4), the SEO Acquisitions Page illuminates conversion origins. A dual bar chart differentiates conversions by channel and type, while a pie chart showcases sources. Two tables spotlight top landing pages initiating the conversion funnel, and present channel-wise conversion counts with periodical comparisons. Filters for conversion type, channel, and date range refine insights, streamlining strategic decision-making for SEOs.

SEO Traffic Analysis
The SEO Traffic page, powered by Google Search Console, gives a snapshot of SEO trends, emphasizing growth or decline and non-branded traffic. A table of top non-brand keywords also provides insights into search behavior, engagement metrics, and rankings, forming a comprehensive tool for dynamic SEO strategy.

SEO Conversion Page
Leveraging Google Analytics (GA4), this page offers a swift overview of conversion metrics. Users can gauge month-over-month performance, review a year-to-date conversion tally, and visualize monthly trends. With filters for conversion type, channel, and date range, SEOs can fine-tune their insights, aiding in strategic planning and predictive insights for more targeted decision-making.
Questions this Dashboard Answers
SEO Traffic Insights
Performance Metrics
- How has our website traffic performed this period compared to the previous one?
- How is our current year’s traffic stacking up against the same timeframe last year?
Keyword Prioritization
- Which non-branded keywords are driving the most traffic to our site?
- Are there keywords that have seen a significant increase or decrease in clicks compared to the previous period?
Engagement Metrics
- Which keywords and associated landing pages have the best click-through rates?
- Are there keywords that have seen a substantial change in impressions or click-through rates compared to the previous period?
Content Relevance
- Which landing pages resonate most with users based on specific query terms?
- Do certain landing pages need optimization based on declining performance metrics?
Brand Recognition
How much of our traffic is from non-branded searches, indicating genuine organic interest versus brand-specific searches?
Search Visibility
- For our top-performing non-branded keywords, where does our site rank on average in search results?
- Have our rankings improved or declined from the previous period for these keywords?
Strategic Adjustments
- Based on clicks, impressions, and average position changes, where should we focus our SEO efforts to maximize results?
- Are there emerging keyword opportunities or declining terms we should know for content optimization?
SEO Conversion Insights
Performance Metrics
- How is our site’s conversion performance this month compared to the previous month?
- What’s the cumulative conversion count for the year so far?
- Which conversion types are performing best?
Trend Evaluation
- Are there any discernible trends or patterns in our monthly conversions over time?
- Are there any seasonal fluctuations or notable peaks in conversions throughout the year?
- How do specific events or marketing campaigns align with spikes or drops in monthly conversions?
SEO Acquisition Insights
Channel insights
- Which channels are most effective at driving conversions?
- How do different conversion types perform across various channels?
- What sources contribute most to our conversions?
Landing Page Analysis
- Which landing pages are most influential in starting the conversion funnel?
- What channels are these top landing pages primarily associated with?
- How have these landing pages’ performances shifted compared to the previous period?
Conversion Dynamics
- How does the conversion count differ across channels?
- Which channels have seen an increase or decrease in conversions recently?
Recent Projects
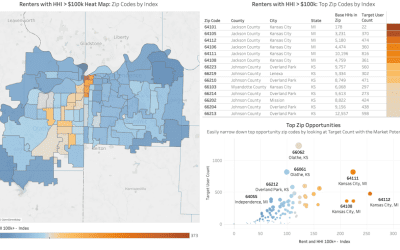
Market Potential Analysis
Utilizing Claritas 360 data, we developed a Market Potential Analysis dashboard, providing zip code-level insights through heatmaps, tables, and scatter plots. This tool pinpointed areas over-indexing in target presence, enabling the client to allocate resources effectively and maximize impact.
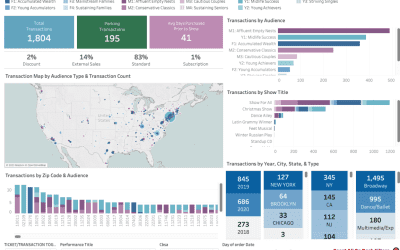
Holistic Audience Analysis in Tableau
A Tableau dashboard, merging 1st and 3rd party data on one page, meets the unique request. Despite its dense metrics, it offers clear insights into audience behavior and purchase trends, empowering hyper-targeted campaigns and an enhanced understanding of their audience’s preferences.
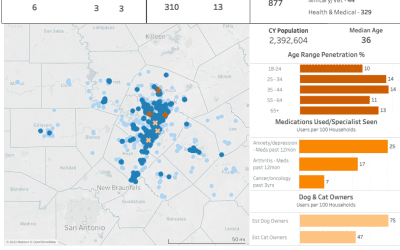
CBD Market Analysis Dashboard
Leveraging Tableau, this project presents a detailed dashboard visualizing competitor and company locations and potential opportunities within each DMA.
Let's work together!
Get in touch so I can learn more about your brand and project requirements.