
Tableau Dashboard
Holistic Audience Analysis
The Challenge
In the dynamic entertainment sector, our client faced challenges understanding their audience’s intricate buying patterns. They envisioned a single-page dashboard, dense with metrics, to distill complex transactional data into actionable insights for enhanced marketing strategies.
The Solution
A Tableau dashboard, merging 1st and 3rd party data on one page, meets the unique request. Despite its dense metrics, it offers clear insights into audience behavior and purchase trends, empowering hyper-targeted campaigns and an enhanced understanding of their audience’s preferences.
The Tools
- Tableau
- First party data
- Third party data
The Dashboard

Audience Insights
This all-encompassing view not only showcases the vastness of the data but translates it into clear, actionable insights, providing a deep dive into the intricacies of the client’s consumer behavior and preferences. Every element has been thoughtfully placed, from detailed transactional data to overarching audience trends.

Unraveling Transaction Nuances
This section spotlights key callout numbers, each tailored based on selected filters. These metrics aided the client with the following:
- Grasping buying behaviors
- Optimizing Pricing Strategies
- Refining marketing approaches

Transactions & Segmentation by Zip
These visuals combined empowered the client with the following:
- Pinpointed transactional regions.
- Understanding of audience distribution and segmentation.
- Enhanced regional targeting for campaigns.
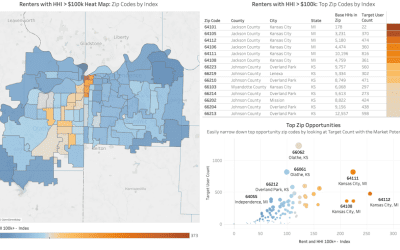
Map: Top-level view into the geographic spread of transactions. Every zip code is represented by a colored point, denoting the dominant audience type. Its size grows with the transaction volume, offering a quick, comprehensive view of transaction hotspots nationwide.
Zip Code Bar Chart: This chart crystallizes transaction details, depicting each zip code’s total sales. The segmented colors within each bar reveal the audience composition, clearly showing audience diversity in every region.

Audience & Show Dynamics
Together, these visual aids enable the client to:
- Identify primary audience segments.
- Understand show-specific demand and its audience blend.
- Strategize marketing based on show and audience intersection.
Audience Bar Chart: Zero in on the leading audiences by transaction volume. This chart provides a hierarchical view of which audience segments are driving the most sales, essential for tailoring marketing efforts.
Performance Title Bar Chart: Unfold the popularity of each show, depicted by transaction volume. The bar colors further enrich understanding, detailing the diverse audience composition of every performance.

Heat Map Tables
Four distinct tables employ varying shades of blue to signify transaction density. The darker the shade, the higher the transaction volume.
Recent Projects
Market Potential Analysis
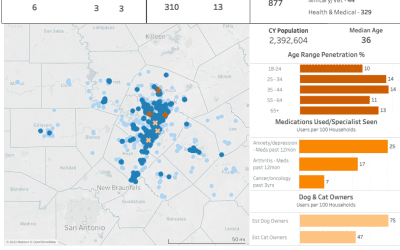
Utilizing Claritas 360 data, we developed a Market Potential Analysis dashboard, providing zip code-level insights through heatmaps, tables, and scatter plots. This tool pinpointed areas over-indexing in target presence, enabling the client to allocate resources effectively and maximize impact.
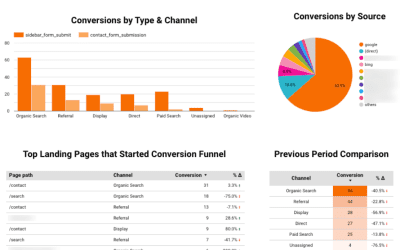
SEO Acquisition & Conversion Dashboard
Looker Studio DashboardSEO Acquisition & Conversion AnalysisThe Challenge SEO marketers often struggle with quantifying their efforts, especially when correlating traffic generation with tangible business results. Traditional tools might show surface-level metrics...
CBD Market Analysis Dashboard
Leveraging Tableau, this project presents a detailed dashboard visualizing competitor and company locations and potential opportunities within each DMA.
Let's work together!
Get in touch so I can learn more about your brand and project requirements.